Visualizer
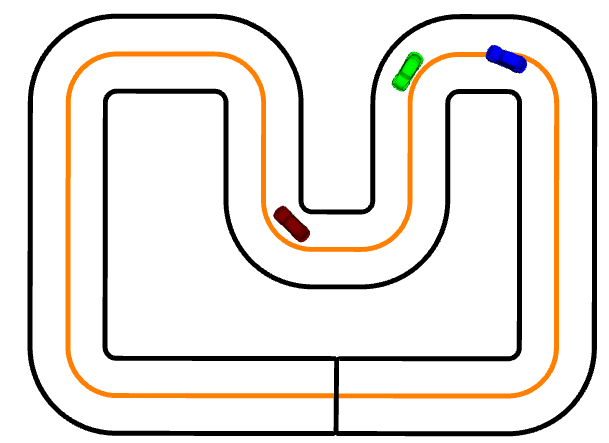
The visualizer node visualizes what is happening on the track. In simulation, it subscribes to the ground truth of the simulator node as well as to the estimated state of the estimator. This allows us to observe what is happening on the track.
When running CRS hardware, it subscribes to the state estimate, such that we can see what CRS is seeing.
The visualization is done by loading the track parameters and subscribing to the car state that is published by the model/estimator. These messages can't directly be visualized by the visualization software RViz. The visualizer will therefore convert them to marker messages and republish them. RViz can then visualize the marker messages.
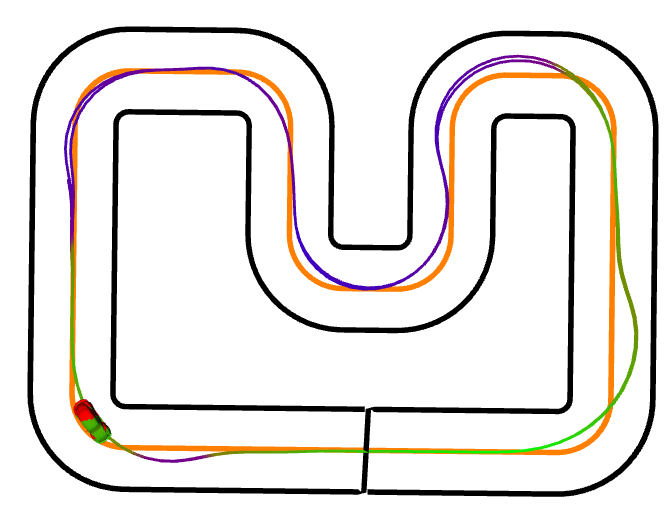
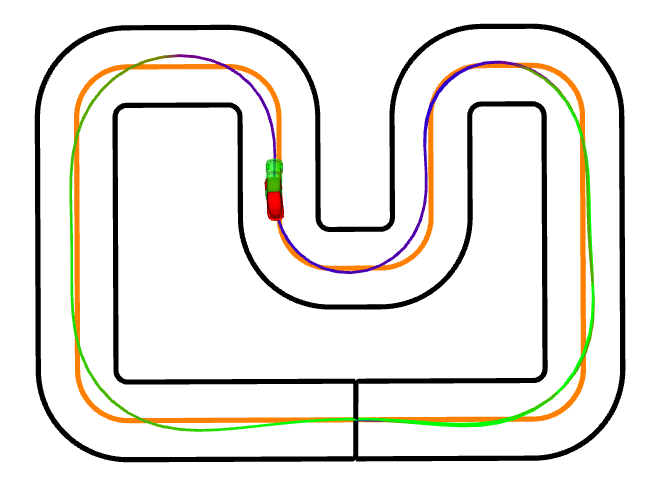 _View of the RVIZ visualizer of the CRS demo track and car._
 The $\textcolor{green}{\text{green}}$ car shows the ground truth position of the car whereas the $\textcolor{red}{\text{red}}$ car shows the current state estimate. Finally, the driven trajectory is highlighted and color coded according to the car speed, whereas low speeds are colored $\textcolor{blue}{\text{blue}}$ and high speeds are colored $\textcolor{green}{\text{green}}$ |
Full Yaml Config Structure
car_track_visualizer.yaml
node_rate: 30 # Update frequency in Hz
show_track_angle: false # If yes, publishes arrow instead of line of track center. This slows down visualization
point_downsampling_factor: 5 # only render every ith point of the track

trajectory:
  show_past_est_trajectory: true # Show past estimated trajectory
  show_past_gt_trajectory: true  # Show past gt trajectory (only simulation)
  number_of_past_samples: -1  # Show all past points (use e.g. 100 to only show the last 100 driven points

estimate: # Color of the estimated car
  color:
    r: 1
    g: 0
    b: 0
    a: 1

gt:      # Color of the groundtruth car
  color:
    r: 0
    g: 1
    b: 0
    a: 1
publish_track: true # If track should be published (e.g. multiple car, only one visualizer needs to publish the track)
ROS Information
| Node Names | Description |
|---|---|
| car_track_visualizer | Main entry point of the visualizer |
Launch File Arguments
| Argument | Default | Description |
|---|---|---|
| gt_car_state_topic | car_state | Topic where state of the car is published. |
| est_car_state_topic | car_state_est | Topic where state of the car is published |
| Subscribed Topics | Description |
|---|---|
| car_state | Groundtruth car state. Only available in visualization |
| car_state_est | Estimated car state |
| Parameters | Description |
|---|---|
| /track/* | All track informations as defined in TODO |
| car_track_visualizer/node_rate | The update rate of the visualizer (Hz) |
| car_track_visualizer/show_track_angle | If true, render center line as arrows that show reference yaw angle |
| car_track_visualizer/point_downsampling_factor | Number how much the track points should be downsampled for visualization purposes (only visualize every i-th track point) |
| car_track_visualizer/trajectory/show_past_est_trajectory | Show past estimated trajectory |
| car_track_visualizer/trajectory/show_past_gt_trajectory | Show past groundtruth trajectory |
| car_track_visualizer/trajectory/number_of_past_samples | How many points of the driven trajectory should be kept in memory for the visualization. Set to -1 to show all points |
| estimate/color/r | Color of the estimated car |
| estimate/color/g | Color of the estimated car |
| estimate/color/b | Color of the estimated car |
| estimate/color/a | Color of the estimated car |
| gt/color/r | Color of the ground truth car |
| gt/color/g | Color of the ground truth car |
| gt/color/b | Color of the ground truth car |
| gt/color/a | Color of the ground truth car |
| car_namespace | Namespace of the car. All car markers will have this as prefix for their namespace |
Examples
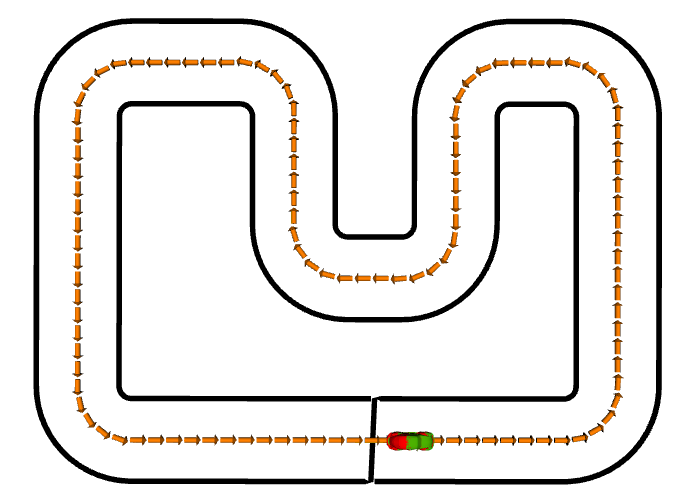
Using arrows to visualize the direction of the center line.
Show config.yaml
node_rate: 30 # hz
show_track_angle: true # If yes, publishes arrow instead of line of track center. This slows down visualization
point_downsampling_factor: 10 # only render every ith point of the track

trajectory:
  show_past_est_trajectory: false
  show_past_gt_trajectory: false
  number_of_past_samples: 300
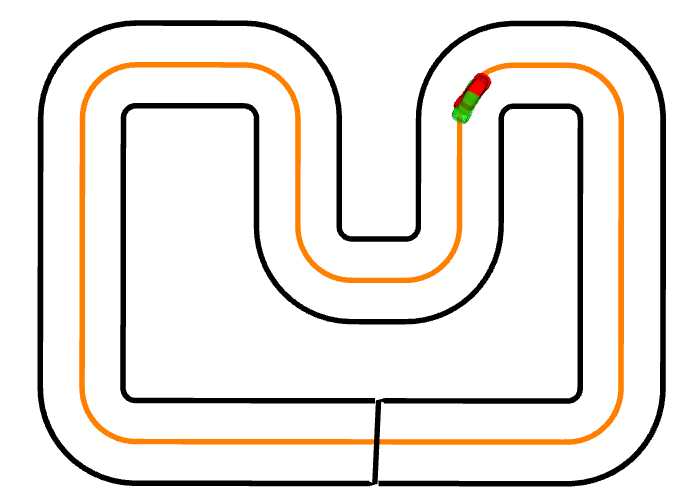
Using a simple line to visualize the center of the track._
Show config.yaml
node_rate: 30 # hz
show_track_angle: false # If yes, publishes arrow instead of line of track center. This slows down visualization
point_downsampling_factor: 10 # only render every ith point of the track

trajectory:
  show_past_est_trajectory: false
  show_past_gt_trajectory: false
  number_of_past_samples: 300
Visualizing the driven trajectory and speed
Show config.yaml
node_rate: 30 # hz
show_track_angle: false # If yes, publishes arrow instead of line of track center. This slows down visualization
point_downsampling_factor: 10 # only render every ith point of the track

trajectory:
  show_past_est_trajectory: true
  show_past_gt_trajectory: false
  number_of_past_samples: 300
Multi Car Setup